Okay, so debugging is hard.
And it becomes way harder when you don’t have access to certain parts of the code and the issue is happening somewhere in the middle of an application’s workflow.
Recently, I was debugging an issue in our backend where reproducing the bug required going through a specific sequence of APIs.
It was not something like:
POST /create
  │
  ▼
bug
It was more like:
Create something
  │
  ▼
Update something
  │
  ▼
Approve something
  │
  ▼
Generate something
  │
  ▼
Receive something
  │
  ▼
Finally hit the API where the bug happens
The problem was that every time I made a change in the backend code, I had to repeat that entire workflow again before I could even test whether my change fixed the issue.
And this is where debugging starts becoming painful.
The API Client Approach & Its Limits
My first option was pretty obvious:
Use an API client.
I use Bruno, so I could manually execute all the APIs required to reproduce the workflow.
For example:
POST /api/order
POST /api/order/:id/approve
POST /api/order/:id/items
POST /api/order/:id/receive
GET  /api/order/:id
Then finally:
GET /api/reportwhere the actual bug was happening.
Technically, this works. But there is a problem.
Every time I restart my backend or change something that affects the workflow, I have to run those APIs again.
And it is not just about clicking “Send”. You have to prepare the request body, check headers, authentication, IDs, query parameters, dependencies between requests, and sometimes copy values from one response into the next request.
Yes, you can automate a lot of this. But now we are building another system just to reproduce the workflow. And I really didn’t want to do that for a bug I was trying to debug.
Why standard alternatives fall short
There are a few obvious solutions, but each has trade-offs:
- Write a testing script: We could write a script that executes
Create ──► Approve ──► Update ──► Receive ──► Verify. This is great for repeated automated testing, but overkill for a one-off debugging session where test data, auth, and API dependency maintenance adds overhead. - Mock the workflow: Mocking isolates components well, but if we mock too much state, we risk debugging an artificial scenario that doesn’t represent real backend behavior.
- Write automated tests: Unit/integration tests are essential engineering practices, but when rapidly investigating an existing system, you just want to answer:
“Does my local backend change actually fix the issue when the real frontend performs the workflow?”
The Idea: Use the Deployed Frontend
At this point I thought: Why am I doing all of this manually?
We already have a frontend deployed. The frontend already knows how to perform the workflow.
It already knows:
- which APIs to call
- in which order to call them
- what request body to send
- what headers are required
- how authentication works
- how to handle the responses
- how to move from one step to another
So instead of reproducing the workflow manually using an API client… Why not just use the application itself?
There was just one problem: I didn’t have access to the frontend repository. And setting up the entire frontend locally (installing dependencies, configuring env vars, API URLs, auth) was something I didn’t want to do just to debug a backend issue.
What I Actually Wanted
I didn’t need the frontend code or local setup. I already had a working deployed frontend.
All I wanted was:
Deployed Frontend
       │
       ▼
  API Request
       │
       ▼
My Local Backend
       │
       ▼
  Local Logs
       │
       ▼
    Debugger
In other words:
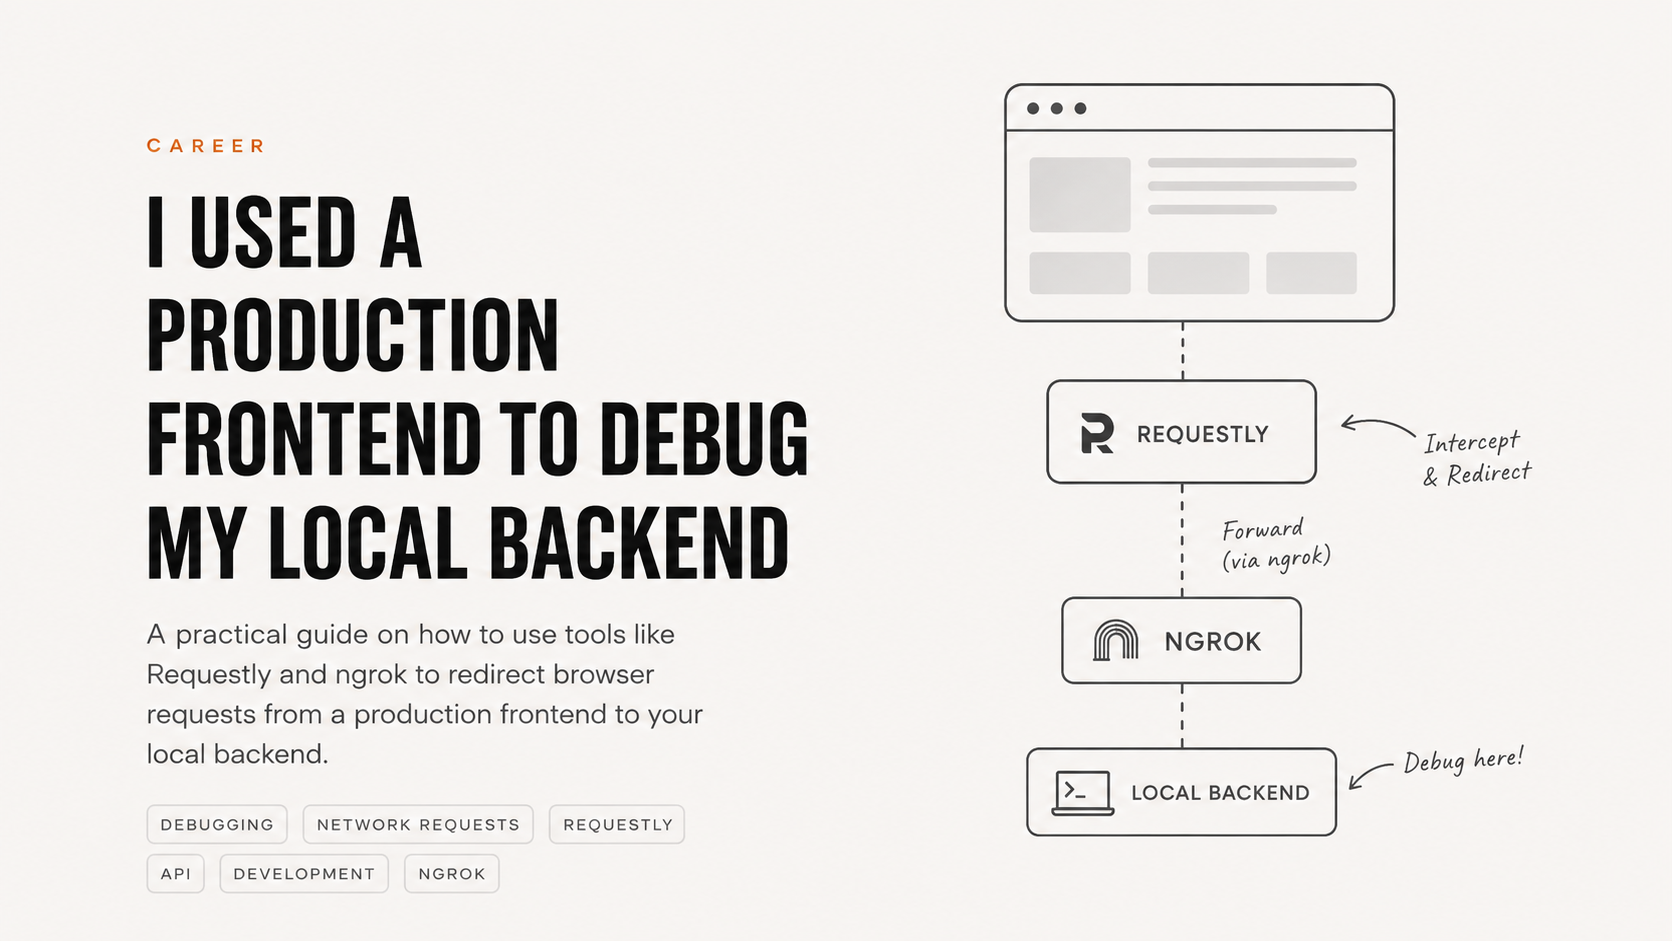
Use the deployed frontend, but send its API requests to my local backend.
Enter Requestly & Tunneling
Requestly is an HTTP interception tool that lets you redirect network requests from one URL to another using exact URLs, wildcards, or regex patterns without touching application code.
So imagine my deployed frontend calls https://api.example.com/api/orders, while my backend runs locally on http://localhost:8000. Requestly lets us transparently route browser traffic to local code.
Before Requestly vs. After Requestly
Before Requestly:
Make backend change ──► Open Bruno ──► Prepare request ──► Run API 1..5 ──► Reproduce bug ──► RepeatAfter Requestly:
Make backend change ──► Refresh app ──► Click UI ──► Requestly redirects ──► Debugger stops ──► RepeatHow to Set Up Requestly + ngrok
Here is the step-by-step setup to route production frontend traffic into your local debugger:
Step 1: Install Requestly
Install the Requestly browser extension or desktop app.
Step 2: Start Your Local Backend
Run your local backend (e.g., npm run dev) on http://localhost:8000.
Step 3: Expose Local Backend via ngrok
You cannot simply redirect a browser request from a deployed HTTPS frontend to
localhost.
Browser security requires a publicly reachable HTTPS endpoint. Use ngrok to tunnel traffic:
ngrok http 8000This generates a public tunnel URL like https://abc123.ngrok-free.dev.
Step 4: Open Requestly Rules
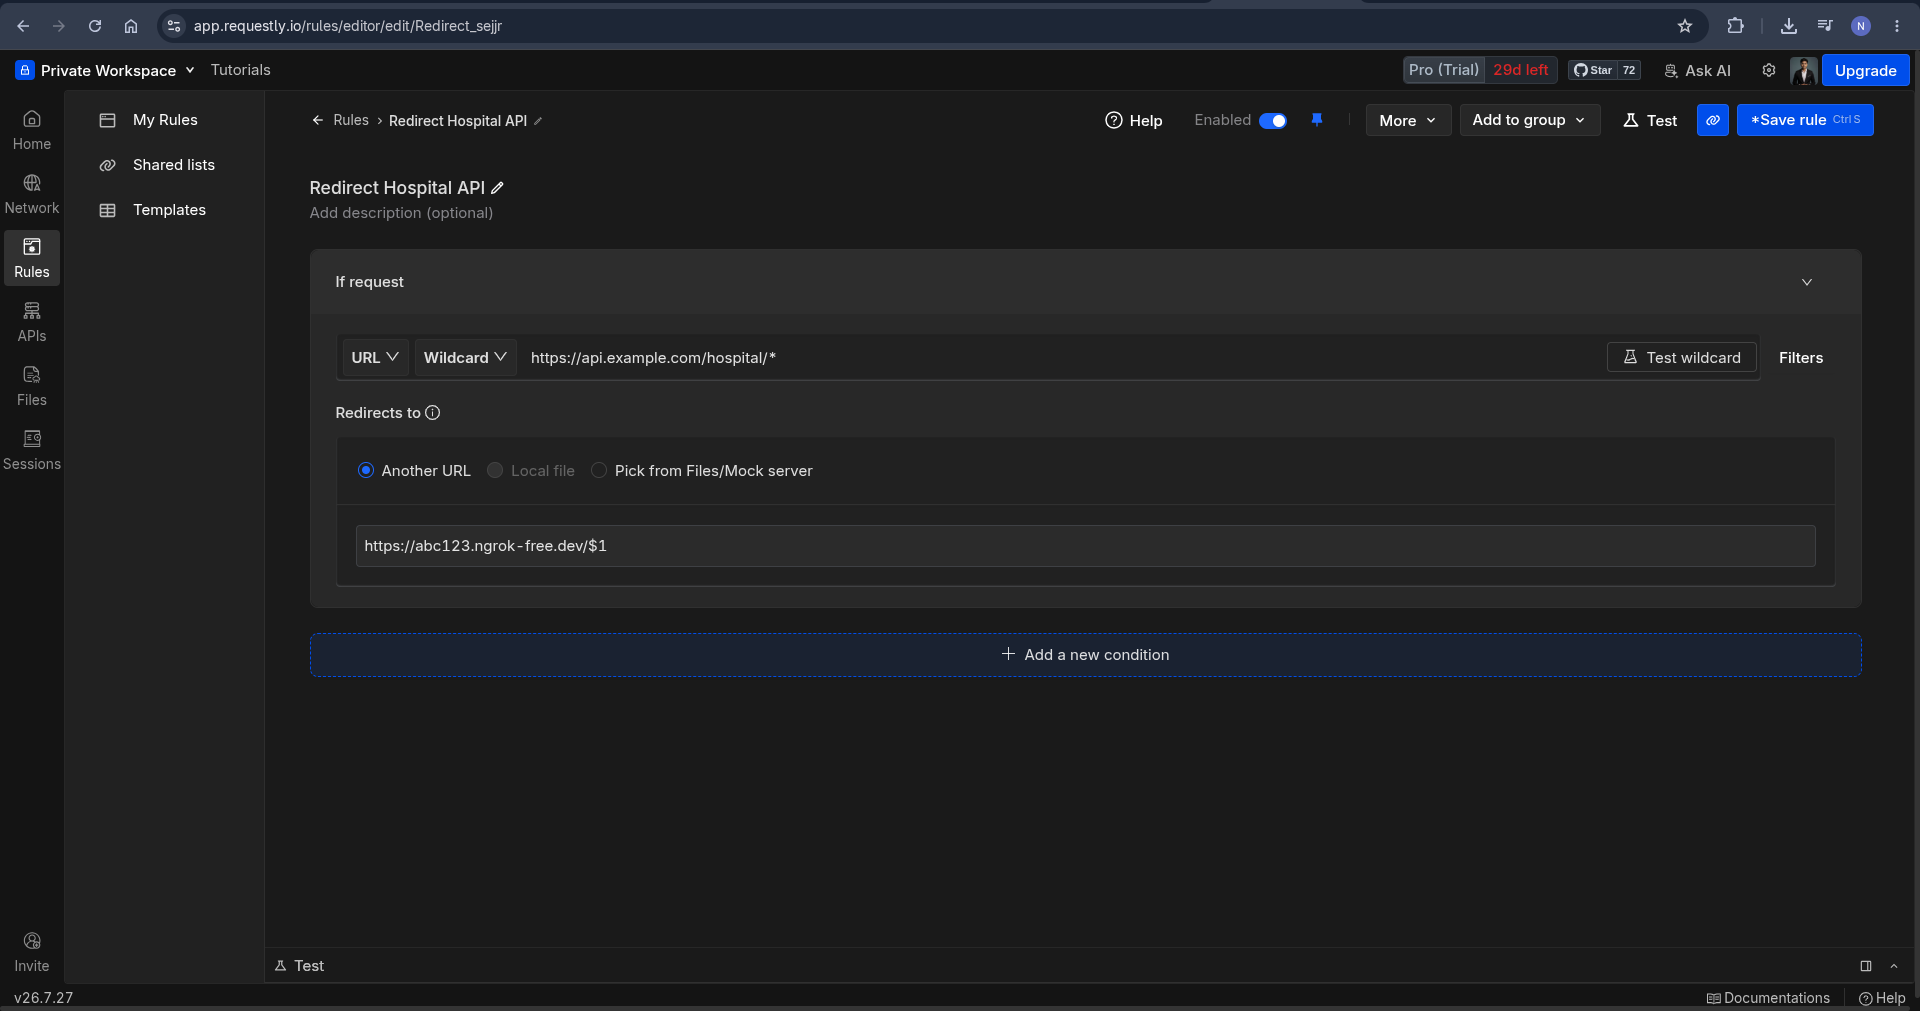
Go to HTTP Rules ──► Create Rule ──► Redirect Request.
Step 5: Configure Source Matcher
Use a Wildcard matcher for minimum necessary scope: https://api.example.com/hospital/*.
Step 6: Preserve Route Path with $1
Use $1 in destination (https://abc123.ngrok-free.dev/$1) so subpaths like /orders/123 map correctly.
Step 7: Enable Redirect Destination
Save and turn on the redirect rule.
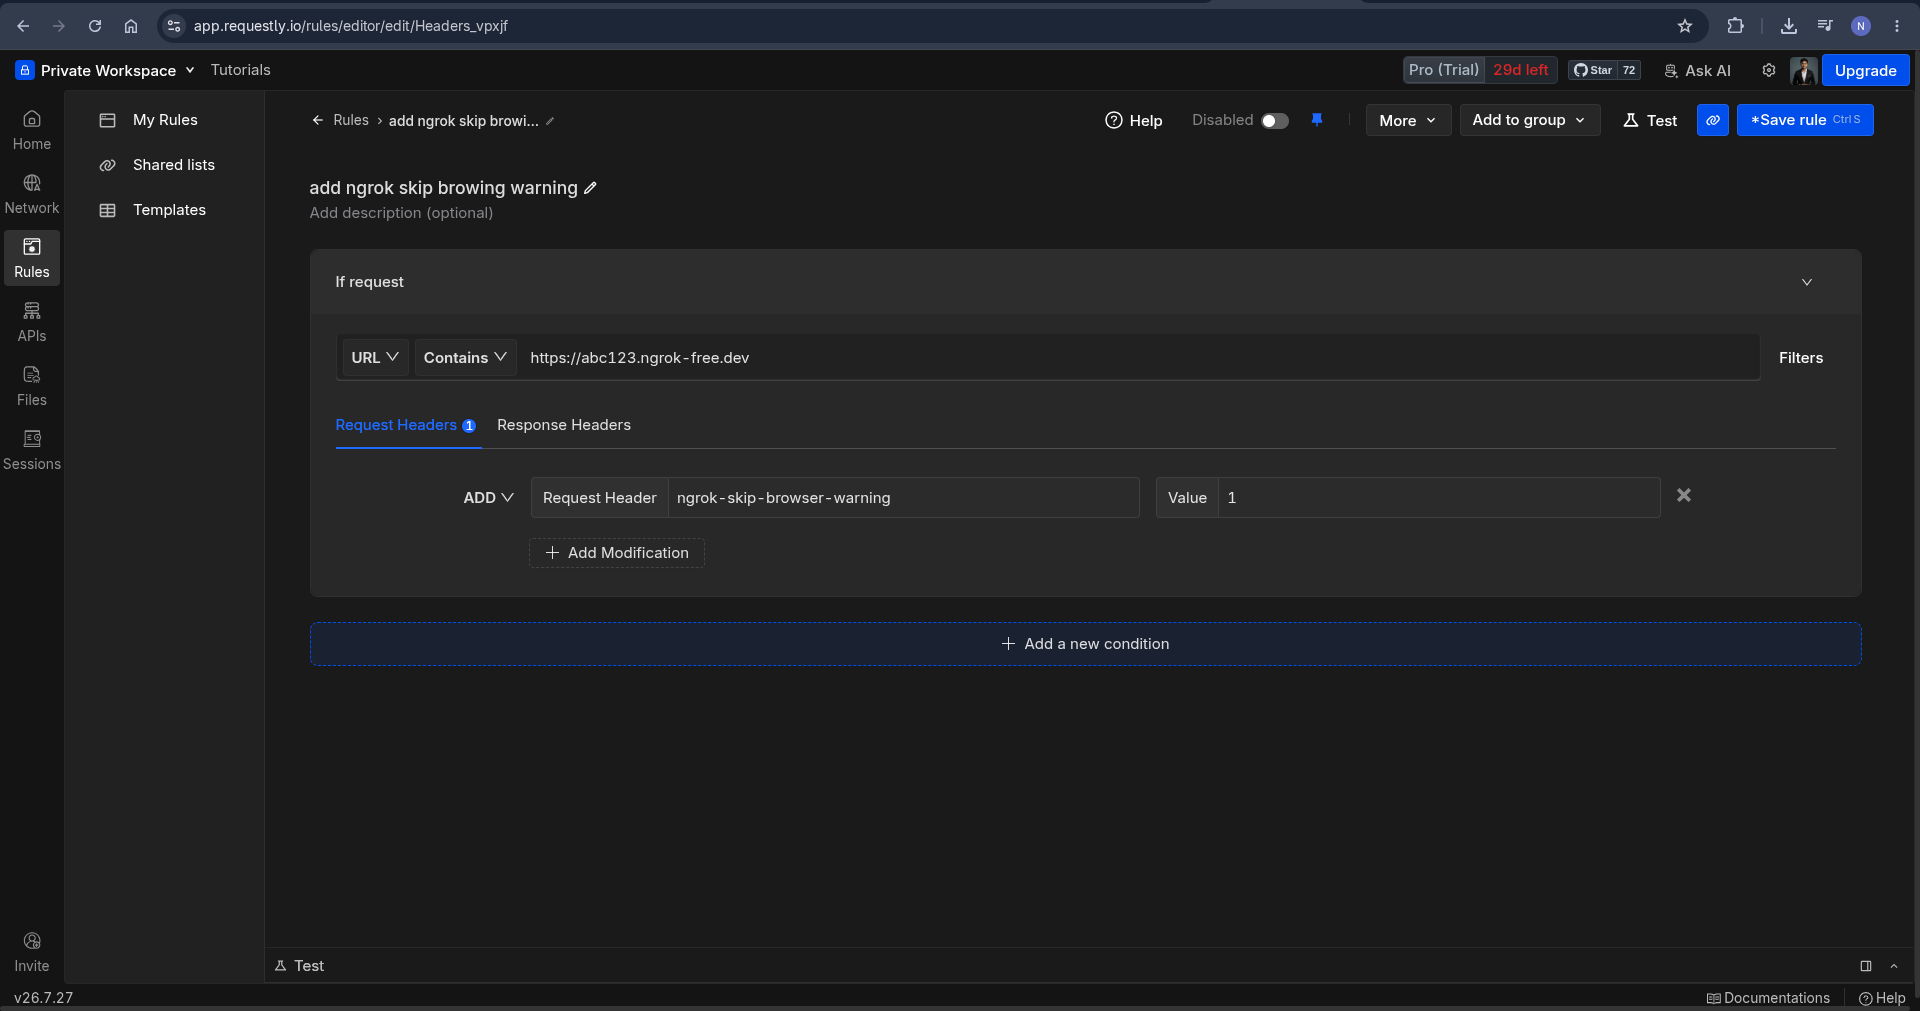
Step 8: Configure ngrok Header Rule (ngrok-skip-browser-warning)
To bypass ngrok’s free tier HTML warning page on API requests, add a Modify Headers rule in Requestly:
- Header:
ngrok-skip-browser-warning - Value:
1
Step 9: Open the Deployed Frontend & Perform Actions
Navigate to https://app.example.com and use the app normally (Login ──► Create ──► Approve ──► Receive).
Step 10: Inspect Local Backend Logs & Debugger
Your breakpoints in Express/Node.js handlers fire automatically as you click buttons in the deployed UI.
Handling Traps: ngrok Interstitials & CORS
Environment & Auth Prerequisites
Redirecting requests doesn’t make local code magically identical to production. Your local server still needs valid DB state, JWT validation keys, and dependent service connections.
CORS vs. Tunnel Error Diagnosis
When browser requests hit https://abc123.ngrok-free.dev, CORS headers must allow the deployed frontend origin:
const corsOptions = {
  origin: true,
  credentials: true,
  methods: ["GET", "POST", "PUT", "DELETE", "OPTIONS", "PATCH"],
  allowedHeaders: ["Content-Type", "Authorization"],
};
app.use(cors(corsOptions));
If OPTIONS preflight returns 204 but GET/POST fails, inspect Network response headers. Seeing Ngrok-Error-Code: ERR_NGROK_6024 means the error is coming from ngrok (e.g. missing ngrok-skip-browser-warning), not an application CORS bug.
Don’t assume every browser error mentioning CORS is an application bug. Follow the request through the network path.
Additional Use Cases & The Core Lesson
Selective Endpoints & Rule Matching
You don’t need to redirect all 50 backend APIs. Start small by redirecting only the single endpoint related to the bug (e.g. POST /api/orders/:id/receive).
Redirect vs. Replace
- Redirect: Maps exact pattern to exact target (
Source ──► Destination). - Replace: Swaps host string while keeping original path (
api.example.com──►localhost:8000).
Beyond Debugging
This technique is also valuable for:
- Testing staging APIs with production frontends
- Validating v2 API contracts before frontend release
- Simulating latency, status 500 errors, or response payload overrides
Production Precautions
Avoid blanket wildcards like https://api.example.com/* ──► localhost to prevent breaking auth or payment gateways. Always disable Requestly rules when done.
The Core Takeaway
Instead of manually building workflow reproduction in Bruno:
Production Frontend ──► Requestly ──► ngrok ──► Local Backend ──► DebuggerSometimes the easiest way to debug a system isn’t to reproduce the system manually.
It’s to let the system reproduce itself — and just change where the request goes.
— Nikhil Gautam